February 29, 2024

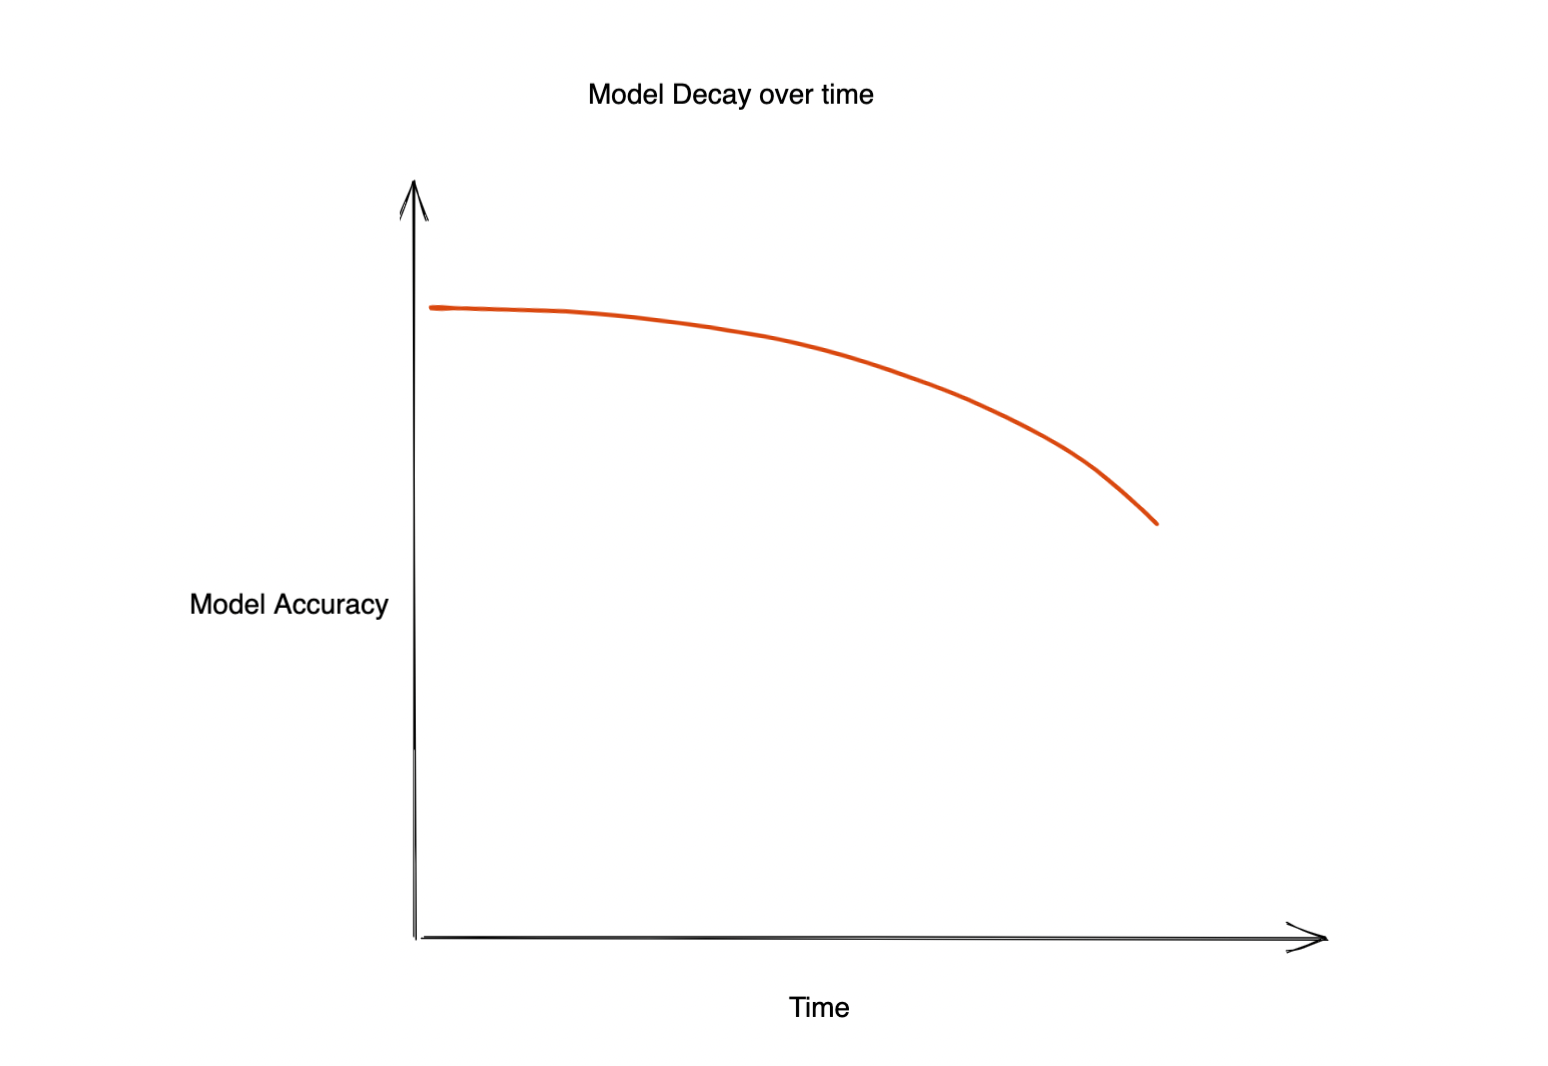
Machine Learning has a significant impact on almost all aspects of the business. But often, the accuracy of the deployed model starts to decay, causing a bad customer experience and impacting the business negatively. So the question is, why does this model's accuracy decrease? It can be due to multiple reasons. For example:
- A spam detection model is not able to detect spam emails correctly after some time as ‘spammers’ update the words and their email patterns which are ‘unknown’ to the model.
- A recommendation model for shopping can significantly be affected by major world events like covid19 breakout, which changes customer preferences.
- A churn prediction model will decay over time as customer behaviors and spending patterns change slowly over time.
So how do we ensure our model performance doesn’t decrease over time? How to find out when to retrain our model to avoid a drop in accuracy?
The answer is ‘drift.’ One needs to detect ‘drift’ timely and ‘accurately’ and take appropriate action accordingly.
What is Model drift?
Model Drift refers to the change in the distribution of data over a period of time. In the context of Machine Learning, we usually refer to the drifts in model features, predictions, or actuals from a given baseline.
Several methods are used for drift tracking, including the Kolmogorov-Smirnov statistic, the Wasserstein distance, and the Kullback-Leibler divergence. These metrics are often used in online learning scenarios, where the target system continually evolves, and the model must adapt in real-time to maintain its accuracy. For example, a recommendation model for movies can drift over time as customer behavior changes over time, and a churn prediction model can drift with changes in economic conditions.
Different types of Model drift:
- Data Drift: This refers to the change in distributions of different features or changes in relationships between different features over time. This can be due to changes in the inputs themselves. For example, for a model finding creditworthiness trained on a year's data, the average income would drift due to economic changes/ recession.
- Concept Drift: Concept drift refers to the drift in ground truth values of the model. This indicates a change in the distribution of the actual values for which the model is being used. Concept drift doesn’t depend on the model but on the ground truth values only. Drift in actual values indicates that there might be a change in the relationship between features and actuals (when compared with the training dataset or previous time frames), which points out the need to retrain the model.
- Prediction Drift: Prediction drift refers to the drift in the distribution of predicted values as compared to predicted values of training data or data from a past time frame. Prediction drift usually indicates an underlying data drift as predictions are a function of the model and features, and the model is unchanged. Prediction drift can help us detect data drift and the decrease in the model's accuracy.

Different Methods of Drift Monitoring
Statistical Methods
Statistical methods are used to measure the difference between the given distribution and the reference distribution. Distance-based metrics or divergence are often used to calculate the drift on a feature or actual value. Statistical methods can be good in detecting outliers or shifts in input distribution and are very simple to compute and interpret. They do not consider the change in the correlation between different features, so they describe the full drift story only when the input features are independent.
Here are a few famous distance-based metrics for calculating drift
- Kolmogorov-Smirnov statistic:
It measures the maximum difference between two cumulative distribution functions. It is a non-parametric test that does not assume a specific distribution for the data. It is widely used in drift detection due to its ability to detect changes in the distribution of the data. - Wasserstein distance:
It is also known as Earth Mover's Distance (EMD). It measures the amount of "work" needed to transform one distribution into another. It has the ability to capture subtle changes in the distribution of the data that may not be captured by other distance metrics.
The Wasserstein distance has recently gained popularity due to its ability to handle high-dimensional and noisy data. - Kullback-Leibler divergence:
It is a measure of the difference between two probability distributions, also known as relative entropy or information divergence. It is a non-symmetric metric, meaning that the KL divergence from distribution A to distribution B is not equal to the KL divergence from distribution B to distribution A.
It is one of the most widely used metrics for drift tracking but the cardinality of the feature/prediction being tracked should not be very high. - PSI (Population Stability Index):
PSI measures how much a population has shifted over time or between two different samples of a population in a single number. It does this by bucketing the two distributions and comparing the percentages of items in each of the buckets, resulting in a single number you can use to understand how different the populations are. The common interpretations of the PSI result are:
- PSI < 0.1: no significant population change
- PSI < 0.2: moderate population change
- PSI >= 0.2: significant population change
So, one can set up monitors on the drift value of features that impact the model's accuracy and take relevant actions based on that.
Model Level Drift (Multivariate drift detection)
- Multivariate drift detection helps in detecting changes or drifts in multiple variables or features together. Unlike univariate drift detection, which only focuses on detecting changes in a single variable, multivariate drift detection considers the relationship between multiple features and does not assume all features are independent of each other.
- Thus, multivariate drift detection methods can detect changes in the distribution of the data, changes in the relationship between variables, and changes in the functional relationship between variables. These methods are particularly useful in complex systems where changes in one variable can have a significant impact on the behavior of other variables.
So multivariate drift helps users get a better understanding of the changes in the inference data. It is also easier to monitor as only one metric needs to be tracked compared to tracking every feature separately. But at the same time, it is computationally heavy to calculate and might be overkill for simpler systems. - Multivariate drift detection algorithms usually depend on a machine learning model to calculate the drift. So these algorithms can be classified as follows:
Using Supervised Methods:
These typically rely on training a binary-classifier model to guess whether a data point is from the baseline data frame. A higher value of the accuracy of the model indicates higher drift.
To find out which features have drifted, the feature importance of this binary classification model is used.
Unsupervised Learning Methods:
Here are a few methods:
Clustering: Use K-means, DBSCAN, or any-other clustering algorithm to find clusters in the reference dataset and current dataset and then find differences between the clusters to judge if the data has drifted or not.
Gaussian Mixture Models(GMM): GMM represents our data as a mixture of Gaussian distributions. GMM can be used to detect multivariate drift by comparing the parameters of the Gaussian distributions of the current dataset with the reference dataset.
Principal Component Analysis (PCA): Use PCA to reduce the dimensions of the dataset and then use regular univariate drift detection algorithms considering the features to be unique.
In summary, multivariate drift detection is helpful in complex systems and is easier to monitor as there is only one KPI to monitor.
Conclusion:
The performance of a model deployed in production will eventually decrease. The amount of time taken for this decay will depend upon the use case. In a few cases, models might not drift until a year, while some models might require retraining every hour! So, understanding the cause of this degradation and detecting it becomes extremely important. Here is where ‘early detection of drift’ can help.
In conclusion, models in production should have appropriate drift tracking or drift monitoring mechanisms and retraining pipelines set up to create the best value from a machine learning model!
TrueFoundry is a ML Deployment PaaS over Kubernetes to speed up developer workflows while allowing them full flexibility in testing and deploying models while ensuring full security and control for the Infra team. Through our platform, we enable Machine learning Teams to deploy and monitor models in 15 minutes with 100% reliability, scalability, and the ability to roll back in seconds - allowing them to save cost and release Models to production faster, enabling real business value realisation.

Subscribe to our Newsletter

Delivered twice a month
Join AI/ML leaders for the latest on product, community, and GenAI developments

%20(11).png)